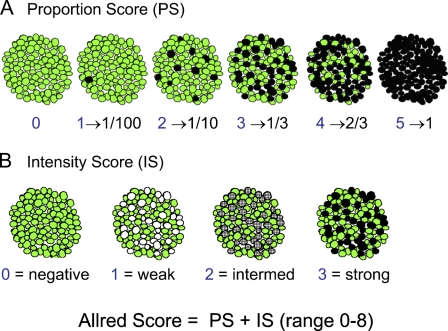
Figure 1.
Two series of cartoons depicting the methodology for calculation of the Allred score. The green color identifies unstained cells, whereas the gray, dark gray, and black colors identify cells stained to different intensities. (A) Series in which the stain intensity is constant (at maximum), and the proportion of stained cells increases from left to right. (B) Series in which the proportion of stained cells is constant (at 1/3), and the stain intensity increases from left to right (from none to maximum). With permission, Allred (2008). http://www.asbd.org/images/D3S9%20-%20Craig%20Allred.pdf

