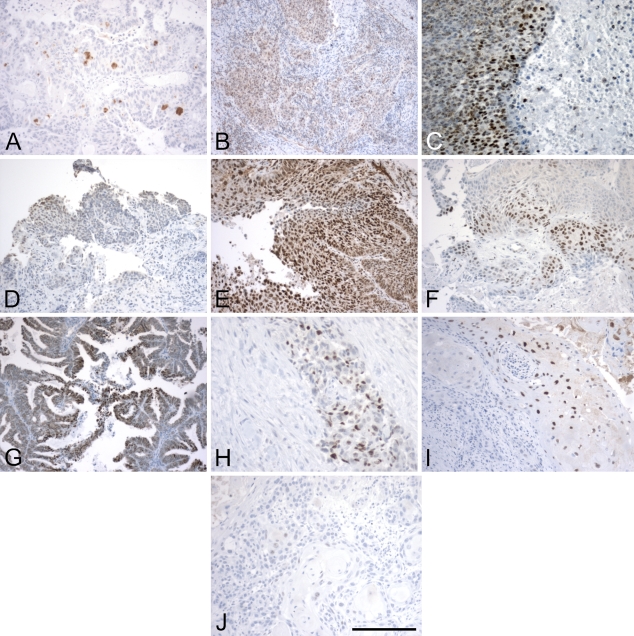
Figure 4.
Images of Hif1 IHC from both head and neck cancer and cervical cancer tissue slices. These represent a spectrum of staining, from no stain or very low stain (A,J) to different representations of high stain (C,E,G) and intermediate staining between the two extremes (B,D,F,H,I). The images were specifically chosen to represent a broad variation in staining pattern. Bar = 200 μm.

