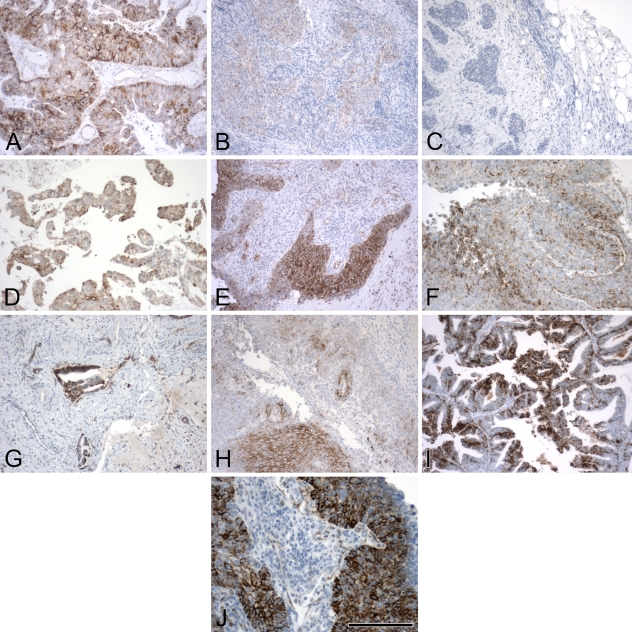
Figure 5.
Images of vascular endothelial growth factor (VEGF) IHC from the same cancer types. These represent a spectrum of staining, from no stain and very low stain (B,C) to different representations of high stain (A,I,J), with intermediate staining patterns in the others (D–H). The images were specifically chosen to represent a broad variation in staining pattern. Bar = 200 μm.

