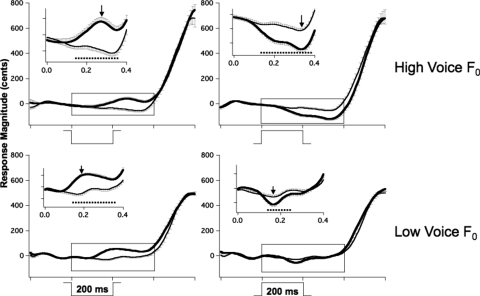
Figure 1.
Representative vocal responses to 200 cent pitch-shifted stimuli as a function of stimulus direction at a high (top) and a low (bottom) voice F0, respectively. Thick lines represent the averaged F0 contours of responses to pitch-shifted feedback, and thin lines represent contours for control trials. The solid vertical arrow indicates time where the response magnitude was measured. The dashed horizontal line represents the onset and offset of the response, and response latency is indicated by the start of this line. The inset shows an expanded portion of average waves. Error bars attached to the contours represent the standard error of the mean for a single direction. Boxes at the bottom indicate the time and the direction of the stimulus.

