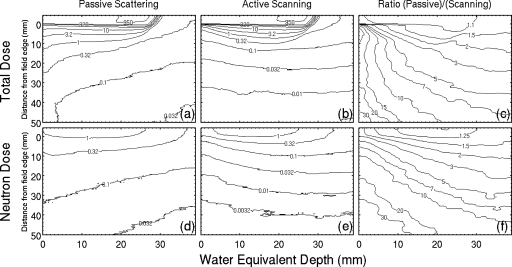
Figure 3.
Simulated absorbed dose distributions for the prostate cancer field: (a) Dtotal,pass, (b) Dtotal,scan, (c) Dtotal,pass∕Dtotal,scan, (d) Dn,pass, (e) Dn,scan, and (f) Dn,pass∕Dn,scan. Contours in (a), (b), (d), and (e) show the contribution of neutrons to the data in Fig. 2a and have units of mGy∕Gy. Contours in (c) and (f) show the dose advantage in scanning for the prostate cancer field, which are factors of 10–30 in the entrance region. The beam enters the phantom at the upper left of each figure and primary fields are the high dose regions at the top of (a) and (b).

