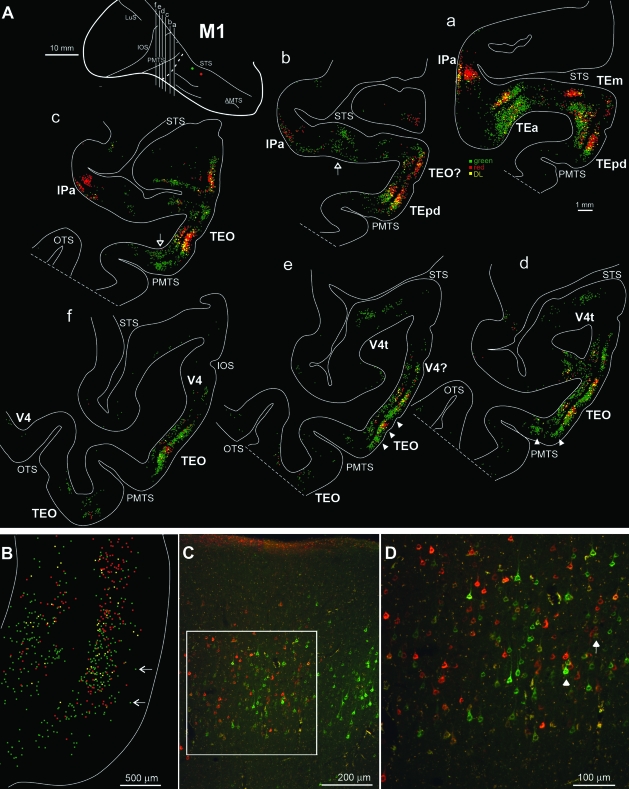
Figure 2.
(A) Drawings of representative coronal sections showing the distribution of red, green, and DL (yellow) retrogradely labeled neurons in M1 in the occipito-temporal cortex. The black background is used to better visualize yellow, DL neurons. Each dot corresponds to one labeled neuron. Sections are in an anterior-to-posterior order (a–f). The different levels from which the sections were taken are indicated as lettered lines in the dorsolateral view of the injected hemisphere in the upper left part of the figure. Dashed lines (in white) on the hemisphere and on the section outlines correspond to a separate block, tangentially sectioned for injection site analysis. Hollow arrows in b and c indicate scattered red cells in green patches; arrowheads in sections d and e indicate single clusters of green, and of green and red cells in TEO. (B) Enlarged view of a labeled field from a section approximately at the level of section b. Arrows indicate neurons in layer 2 with a quasi-regular spacing. (C) Photomicrograph of a representative field of labeled neurons, from a section close to b. The white box indicates the region shown at higher magnification in (D). (D) Arrowhead indicates a tight clump of 4 cells and the arrow indicates a vertical row of neurons (see “Fine scale,” in the text). OTS = occipito-temporal sulcus. Other abbreviations as in Figure 1.

