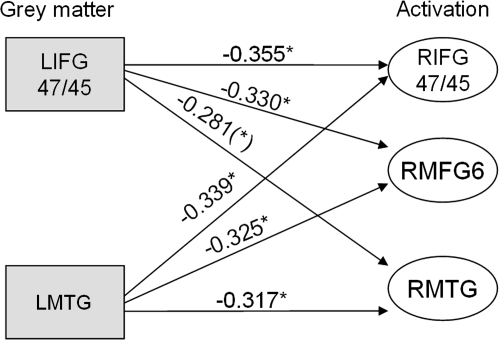
Figure 8.
Correlations between measures of GM integrity and neural activity in the older group. Gray squares represent GM changes and white ovals represent significant clusters of activity in specified regions. The graph shows that decreases in GM in left frontotemporal regions are associated with increases in right frontotemporal activation (*)P < 0.1, *P < 0.05.

