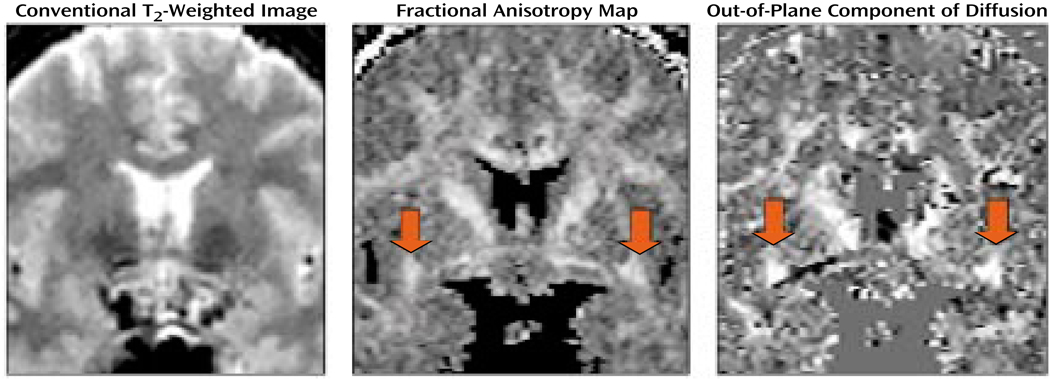
FIGURE 3.
Conventional T2-Weighted Image, Fractional Anisotropya Map, and Out-of-Plane Diffusion Map for a Selected Coronal Plane in a Normal Comparison Subjectb
a Deviation from the isotropic diffusion.
bThe conventional image does not show white matter fiber tracts in the brain. The fractional anisotropy map highlights the white matter bundles in the brain, with the red arrows pointing to the uncinate fasciculi. The image on the right displays the out-of-plane component of the diffusion; high intensity corresponds to the fiber tracts perpendicular to the plane, thus differentiating the uncinate fasciculi from the fiber tracts with other directions (again, red arrows point to uncinate fasciculi).

