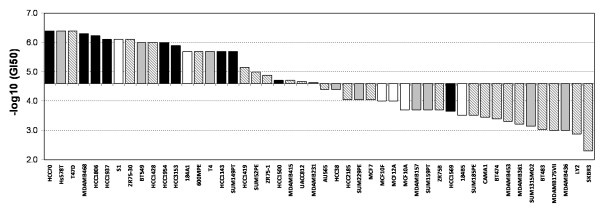
Figure 1.
Growth inhibition (GI50) sensitivity profile of the breast cell lines to PG-11047. Cell lines are arranged from sensitive (left) to resistant (right) based on median centred GI50 value. Solid bar, basal; gray bar, claudin low; striped bar, luminal subtype; white bar, non-malignant breast cells.

