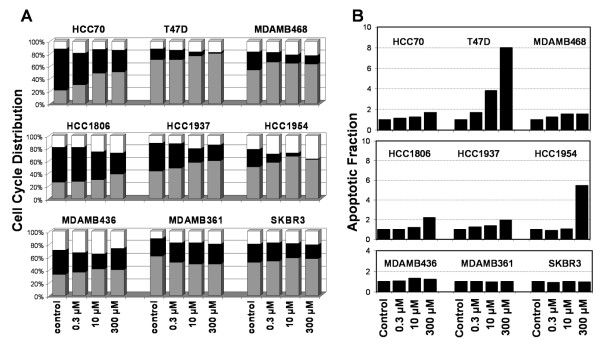
Figure 3.
Cell cycle distribution and apoptotic fraction of PG-11047 treated breast cancer cell lines. Six sensitive (top two rows) and three resistant (bottom row) cell lines were tested with PG-11047 for 72 h. (A) Fractions of cells estimated to be in the G1 (gray bar), S (black bar) and G2/M (white bar) phases of the cell cycle. (B) Corresponding relative apoptotic activity normalized to untreated control relative cell number.

