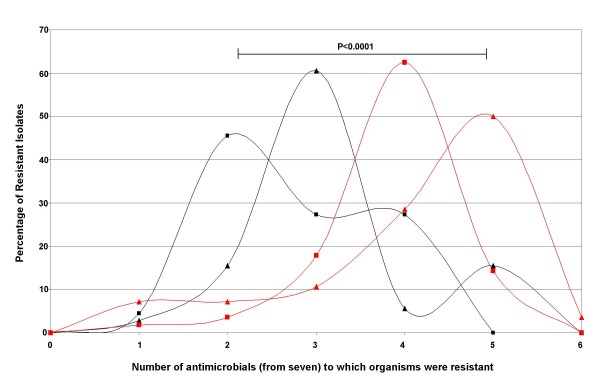
Figure 6.
The increasing proportions of antimicrobial resistant S. sonnei and S. flexneri during a fourteen year transition. The distribution of the proportion of S. sonnei and S. flexneri isolates that were resistant to one or more of seven antimicrobials tested. S flexneri strains (red lines) were significantly more likely to be resistant to more antimicrobials that S. sonnei (black lines) over both collections compared. S. sonnei and S. flexneri were significantly more likely to be resistant to more antimicrobials when period C (2007 - 2008) (lines with triangles) was compared to period A (1995 - 1996) (lines with squares).

