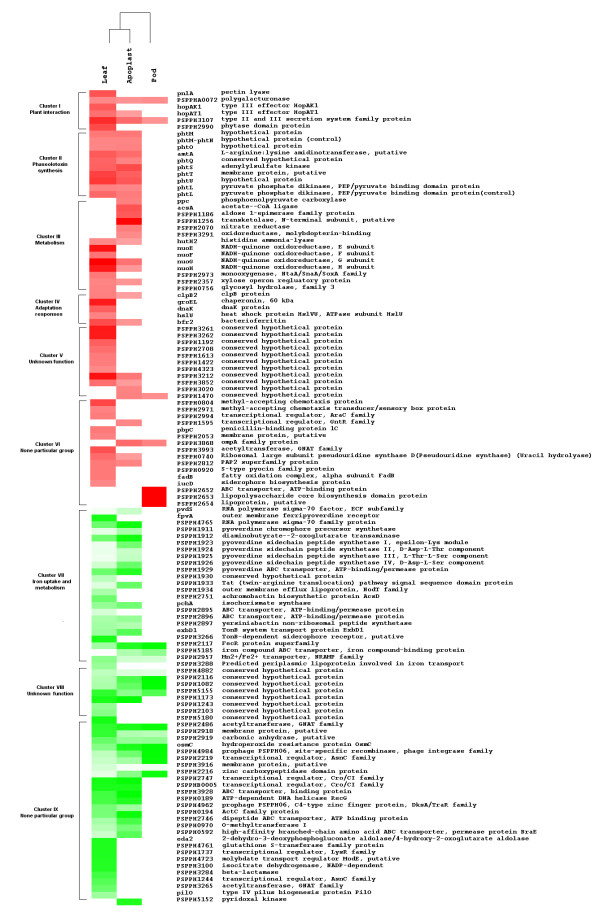
Figure 3.
Clustering of genes with distinct patterns of differential expression. Differentially expressed genes with ≥ 2 or ≤ 0.5 fold change were grouped manually according to the function of their gene products, and then clustered using the complete linkage cluster algorithm. This analysis grouped genes with similar putative or known function. Red and green squares represent induced and repressed genes respectively. Intensity of color is related to magnitude of differential expression. Roman numerals represent clusters of genes mentioned in discussion of results. The complete list of the differentially expressed genes and their fold changes can be found in Additional file 1.

