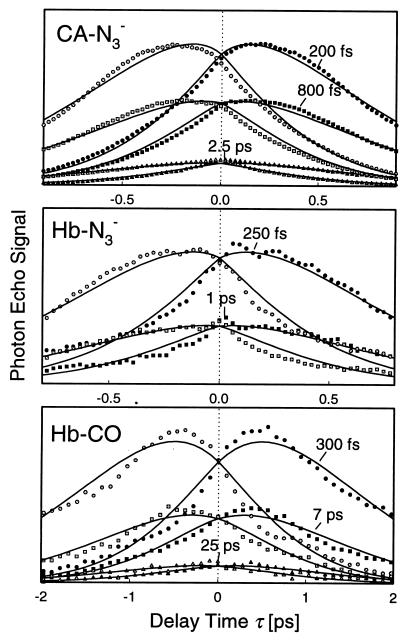
Figure 2.
Stimulated-photon echo signal of CA–N3−, Hb–N3−, and Hb–CO plotted against delay time τ for selected delay times T together with global fits (solid lines). The signals in the kα (solid symbols) and the kβ (shaded symbols) directions are both shown. The kα signal at +τ is identical to the kβ signal at −τ, and the shift between both signals is a measure of inhomogeneity at time T. The asymmetry of the signals with respect to τ decays with time T.

