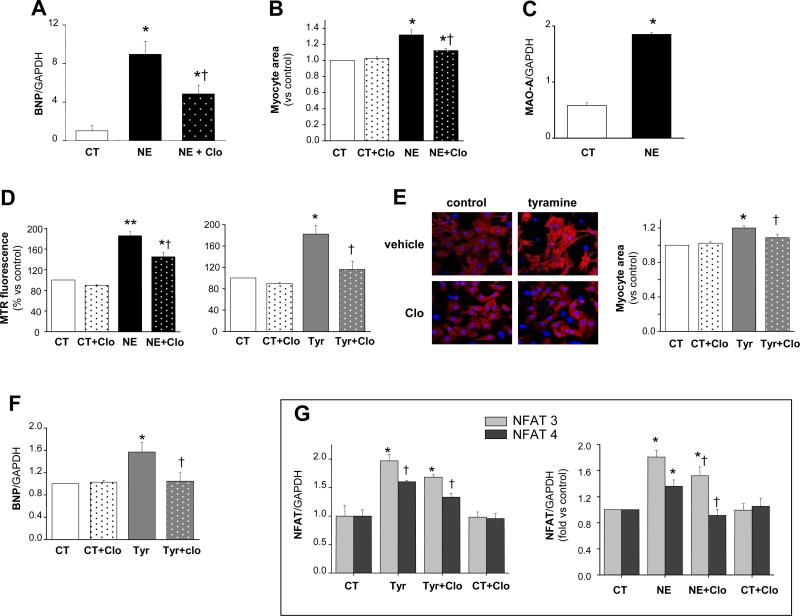
Figure 1.
MAO-A triggers hypertrophy in neonatal rat cardiac myoctes. A: BNP gene expression levels in vehicle- or NE-treated myocytes (10 μmol/L, 24 hrs) in the absence or presence of clorgyline (2 μmol/L). B: Myocyte area measured in control and NE-treated cells (10 μmol/L NE, 24 hours) without or with clorgyline. C: MAO-A gene expression in vehicle and NE-treated cells. D: Mitochondrial ROS production determined by Mitotracker Red after 2 hours of incubation with 10 μmol/L NE (left) or 20 μmol/L tyramine (right), without or with clorgyline. E: Myocyte hypertrophy induced by tyramine determined by α-actinin staining and shown as increase in myocyte area (20 μmol/L, 24 hours). F: BNP gene expression levels in vehicle or tyramine treated myocytes (20 μmol/L, 24 hours), without or with clorgyline. G: NFAT3 and NFAT4 increase in gene expression. *p<0.05 vs control, **p<0.001 vs control, †p<0.05 treatment+clorgyline vs treatment alone.

