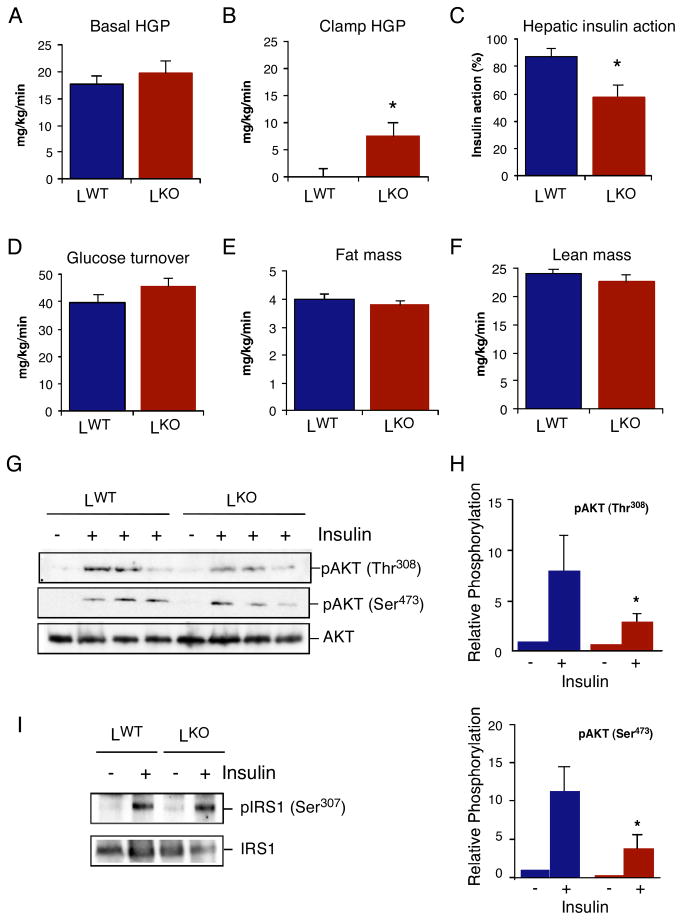
Figure 3. Mice with JNK1-deficient hepatocytes exhibit hepatic insulin resistance.
(A-F) Insulin sensitivity was measured using a hyperinsulinemic-euglycemic clamp in conscious chow-fed LKO and LWT mice. (A) Basal hepatic glucose production (HGP). (B) Insulin-stimulated rate of HGP. (C) Hepatic insulin action, expressed as insulin-mediated percent suppression of basal HGP. (D) Insulin-stimulated whole body glucose turnover. (E) Whole body fat mass measured using 1H-MRS. (F) Whole body lean mass. The data presented are the mean ± SE for 6 ~ 8 experiments. Statistically significant differences between LKO mice and LWT mice are indicated (*, P < 0.05). (G,H) Chow-fed LKO and LWT mice were administered insulin (0.3U/kg body mass) by intravenous injection (5 mins). The activation of AKT in the liver was examined by immunoblot analysis by probing with antibodies to AKT and phosphoAKT. The relative amount of phosphoAKT is presented as the mean ± SD (n = 3). Statistically significant differences between LKO and LWT mice are indicated (*, P < 0.05). (I) Chow-fed LKO and LWT mice were administered insulin (0.3U/kg body mass) by intravenous injection (5 mins). The phosphorylation of IRS1 on Ser-307 in the liver was examined by immunoblot analysis by probing with antibodies to IRS1 and phosphoSer-307 IRS1.

