Figure 1b.

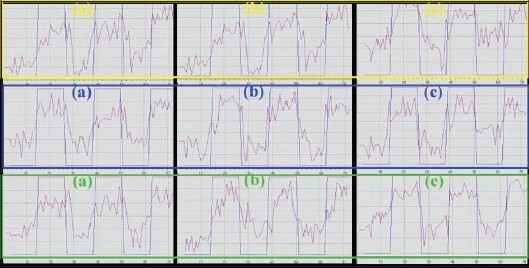
The time course of BOLD signal change in the activated motor cortex corresponding to color boxes in Figure 1a. (a) TE = 35 ms, (b) TE = 45 ms, (c) TE = 55 ms

The time course of BOLD signal change in the activated motor cortex corresponding to color boxes in Figure 1a. (a) TE = 35 ms, (b) TE = 45 ms, (c) TE = 55 ms