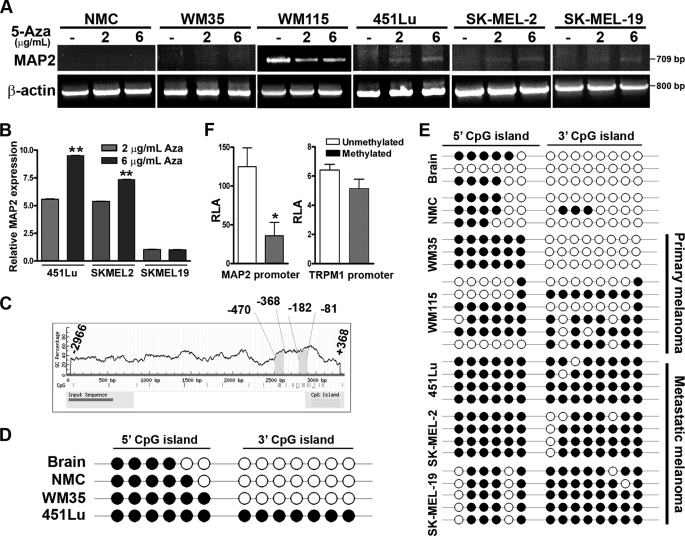
FIGURE 1.
Demethylation induces MAP2 expression in metastatic melanoma cells. A, MAP2 expression is induced by the DNA-demethylating agent 5-aza. Normal neonatal melanocytes (NMC) and a panel of melanoma cell lines were treated with or without 5-aza for 72 h and analyzed for MAP2 expression by RT-PCR using primers that amplify a 709-bp fragment that spans human MAP2 exons 3–9. Actin as a control for RNA loading is shown. B, MAP2 expression in melanoma cells treated with or without 5-aza was analyzed by multiplex qPCR using the TaqMan® expression assay. Data are represented as relative expression by calculating 2−ΔΔCT normalized to its untreated control. Representative data from three experiments are shown (mean ± S.E.; *, p < 0.001). C, computational prediction of CpG islands in the MAP2 promoter region using MethPrime software. Two CpG islands were identified in the 3.3-kb (upstream from transcription start site to +368 to −2966) MAP2 promoter region, a promoter-proximal 3′ (−81 to −182) CpG island, and a distal 5′ (−368 to −470) CpG island. Criteria used for prediction were island size >100 bp, GC percentage >30%, and observed/expected CpG ratio >0.6). CpG islands are indicated by a gray box, and the numbers indicate nucleotides in the promoter region upstream from the transcription start site. D, the MAP2 promoter is hypermethylated in metastatic melanoma. The methylation status of each CpG site was determined by direct bisulfite DNA sequencing of PCR products of MAP2 promoter CpG islands in human brain DNA, human melanocyte DNA, and melanoma cell line DNA. The black circles indicate methylated CpG sites, and white circles indicate unmethylated CpG sites. E, sequencing of the individual clones generated by cloning PCR products of bisulfite DNA from brain, melanocyte, and human primary and metastatic melanoma cell lines. F, in vitro methylation of MAP2 promoter inhibits its activity. MAP2 and TRPM1 promoters were methylated in vitro using MsssI enzyme, ligated to pGL3-luciferase reporter plasmid, and transfected to 451Lu cells, and luciferase activity of methylated and unmethylated promoter was measured. Representative data from three independent experiments are shown (mean ± S.E.; *, p < 0.001). RLA, relative luciferase activity.

