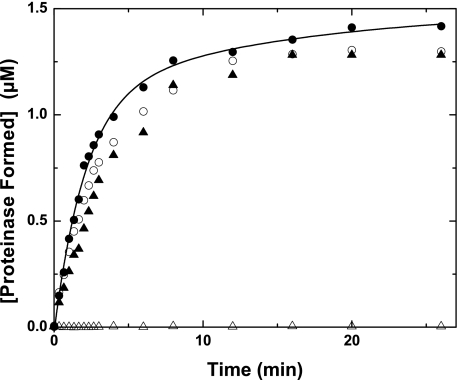
FIGURE 2.
Formation of proteinase products from prothrombin variants. Reaction mixtures contained 1.4 μm IIVariant, 30 μm PCPS, 6 μm DAPA, 30 nm Va, and 0.2 nm Xa. The initial velocity of S2238 hydrolysis was determined on aliquots withdrawn and quenched at the indicated times and converted to the concentration of proteinase formed as described under “Experimental Procedures.” Data obtained with IIWT (●), IIRR (○), IIRGR (▴), or II-1δ (▵) are illustrated. The line was arbitrarily drawn.

