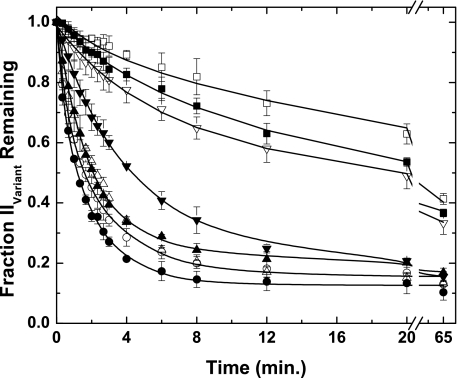
FIGURE 4.
Fate of prothrombin variants following cleavage by prothrombinase. Progress curves for prothrombin consumption were constructed by quantitative densitometry following fluorescence scanning of gels as illustrated in Figs. 1 and 3 and normalized as described. The data sets correspond to those describing the fate of IIWT (●), IIRR (○), IIRGR (▴), II-1δ (▵), II-2δ (▾), II-3δ (▿), II-4δ (■), and IIQ320 (□). Data points and error bars denote means ± 1 S.D. from 2–5 experiments. The lines were arbitrarily drawn. Initial rates determined from these progress curves are presented in Table 2.

