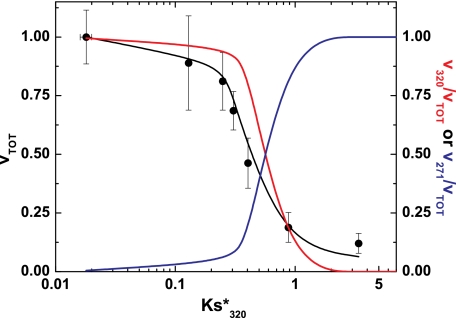
FIGURE 6.
Kinetic accounting of the action of prothrombinase on prothrombin variants. Normalized rates ± 2 S.D. for the consumption of all prothrombin variants with the exception of IIQ320 are plotted versus measured values for Ks*320. The solid black line was calculated using Equations 1, 2, and 5 using the values in Table 2 (see “Results”), Ks*271 = 4.3, kcat320 = 94 s−1, and kcat271 = 100 s−1. The red and blue lines denote the fractional contributions of cleavage at the 320 region or the 271 site to the rate of prothrombin cleavage.

