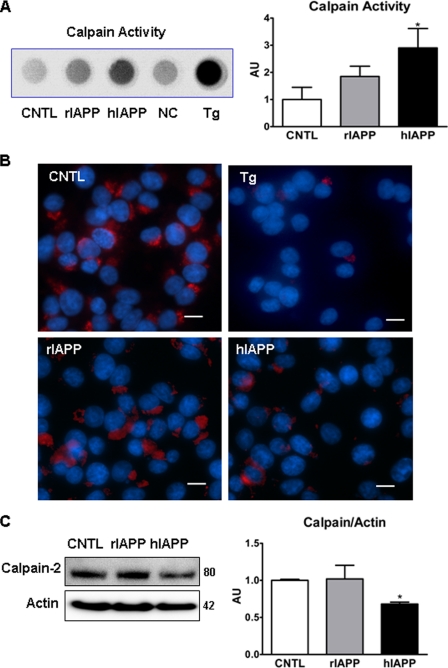
FIGURE 3.
Overexpression of hIAPP in INS 832/13 cells reduces amount of inactive calpain 2. A, calpain proteolytic activity was measured by a kit 12 h post-transduction. Tg, cells treated with 1.0 μm thapsigargin for 4 h (positive control); NC, negative control, cell lysate without the assay substrate; CNTL, control. B, immunofluorescent images of INS 832/13 cells transduced with hIAPP and rIAPP for 48 h or treated with thapsigargin (Tg, positive control) and stained with anti-calpain-2 antibody (red) and DAPI (blue). Scale bar is 10 μm. C, representative Western blot and quantification of calpain-2 protein expression relative to actin. Data are the mean ± S.E. from four (A) and three experiments (B and C); *, p < 0.05. AU, arbitrary unit.

