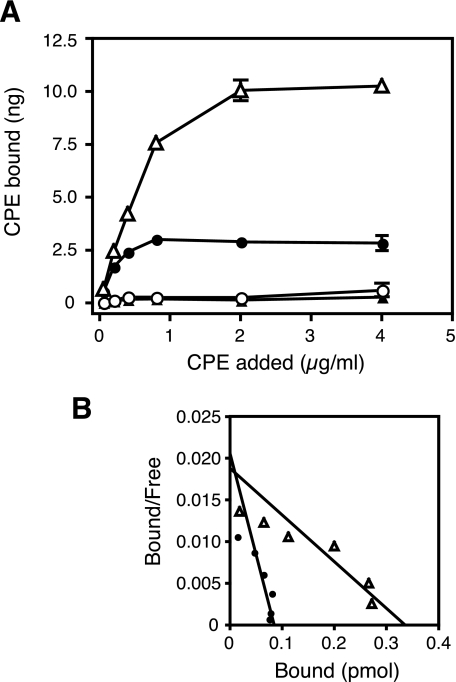
FIGURE 2.
Effects of CPE-SR on binding of 125I-CPE to L929 cells expressing Cldns. L929 cells were incubated with 125I-labeled CPE at various concentrations, and the amounts of bound CPE were determined as described under “Experimental Procedures.” The experiments were repeated at least three times, and representative results are shown. A, saturation curves of the binding of 125I-CPE to cells expressing Cldn4 (filled circles), Cldn5 (filled triangles), Cldn4-5-4 (open circles), or Cldn5-4-5 (open triangles). Each plot represents the mean ± S.D. (n = 3). B, Scatchard plots of the data shown in the A. The data of the cells expressing Cldn4 (filled circles) and Cldn5-4-5 (open triangles) are shown. Numbers of moles of His-tagged CPE were calculated with a molecular mass of 37,850 Da. The Scatchard lines were drawn based on the instructions of Prism 4 software.

