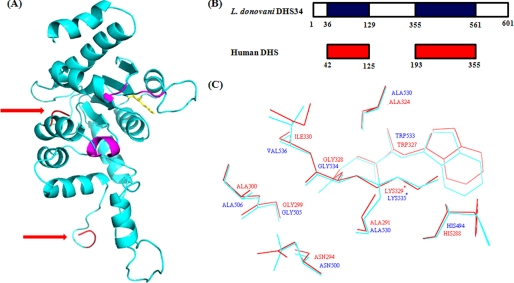
FIGURE 3.
Structural modeling of DHS34. A, the DHS34 model was generated using MODELLER (version 8.0). The catalytic lysine residue is shown in yellow sticks. The regions of insertion are depicted by red arrows. The probable NAD+ binding region is shown in magenta. B, alignment showing homologous residues from L. donovani DHS34 (blue) and human DHS (red). C, residues around active site lysine (indicated by asterisks) of both human DHS (shown in red) and modeled DHS34 (shown in cyan).

