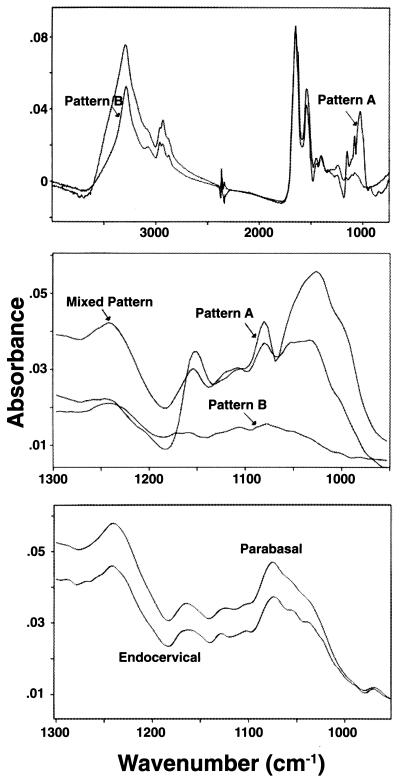
Figure 1.
IR spectra of normal cervical epithelial cells. The main spectral patterns (A and B) of superficial cells are shown in the region 900 cm−1–4,000 cm−1 (Top) and in detail in the Middle (region 900–1,250 cm−1), which also shows the mixed pattern. Bottom, the spectra of parabasal squamous and endocervical cells. Both belong to pattern B; the absence of the 1,026 cm−1 peak is characteristic.

