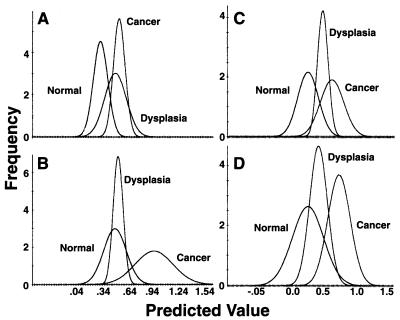
Figure 3.
Chemometric analysis of spectra of normal, dysplastic, and malignant cervical samples. Pattern A spectra: The calibration reference was created from representative spectra from cytologically normal cells from either normal and dysplastic samples (A) or from normal and malignant samples (B). Pattern B spectra: The calibration reference was created from spectra from cytologically normal cells from either normal and dysplastic samples (C) or from normal and malignant samples (D).

