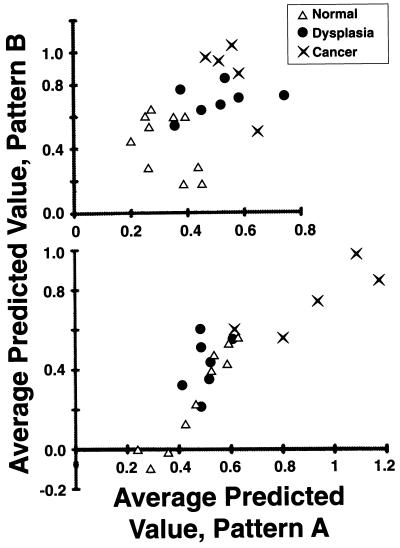
Figure 4.
Average predicted values of pattern A versus pattern B spectra of normal, dysplastic, and malignant cervical samples. The calibration reference was created from representative spectra from cytologically normal cells from either normal and dysplastic samples (Upper) or from normal and malignant samples (Lower). Although no perfect separation of normal, dysplastic, and malignant samples is achieved, clustering of samples is evident.

