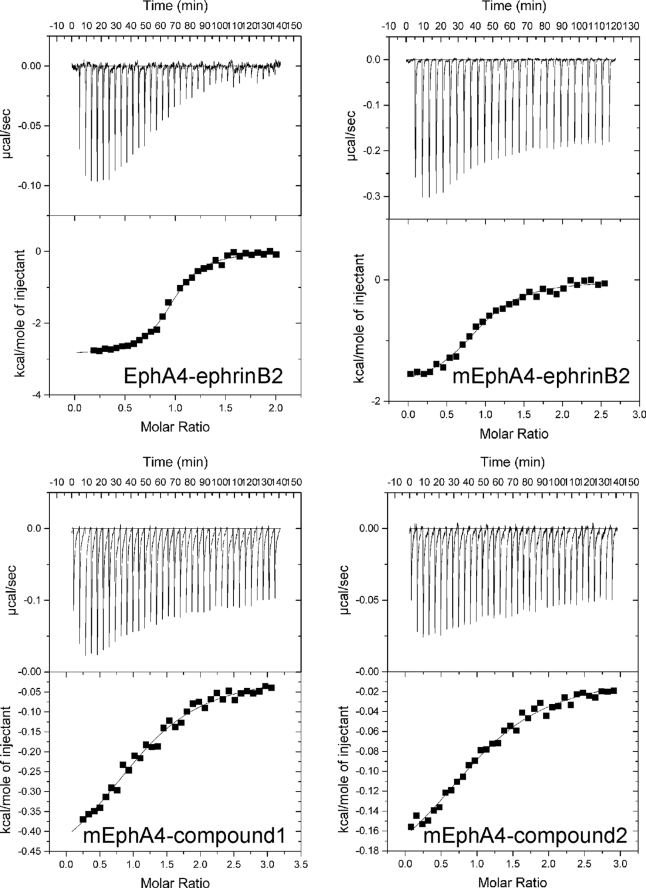
FIGURE 2.
Characterization of EphA4 binding to ephrin-B2 and two small molecule antagonists by isothermal calorimetry. Shown are ITC profiles for the binding reactions of wild-type and mutant EphA4 (mEphA4) with ephrin-B2 and compounds 1 and 2 (upper part of each panel) and plots of the integrated values for the reaction heats (after blank subtraction and normalization to the amount of ligand injected) versus EphA4/ligand molar ratio (lower part of each panel). The results and detailed conditions for the ITC experiments are presented in Table 1 and under “Experimental Procedures.”

