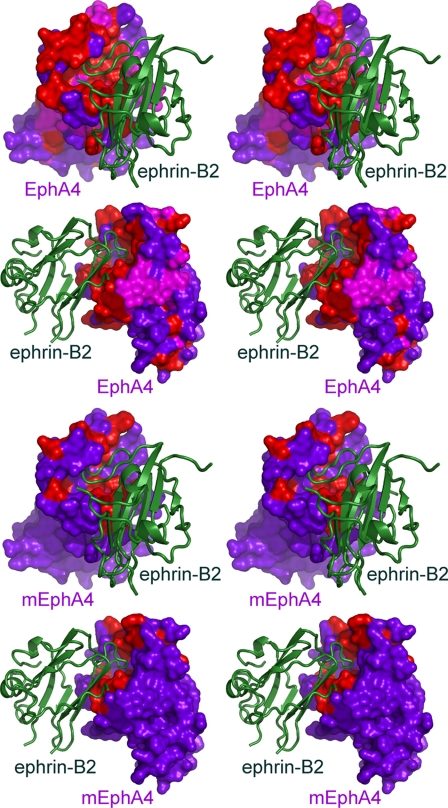
FIGURE 7.
NMR mapping of Eph-ephrin binding interfaces in solution. The stereo pairs show the perturbed residues in wild-type EphA4 and mutant EphA4 (mEphA4) in complex with ephrin-B2, which were mapped using NMR HSQC titrations. The EphA4 residues that are shifted in the complex are colored pink; those that have disappeared are colored red; and those that are unchanged are colored violet. EphA4 is shown in surface mode, and ephrin-B2 is shown as a ribbon.

