FIGURE 1.
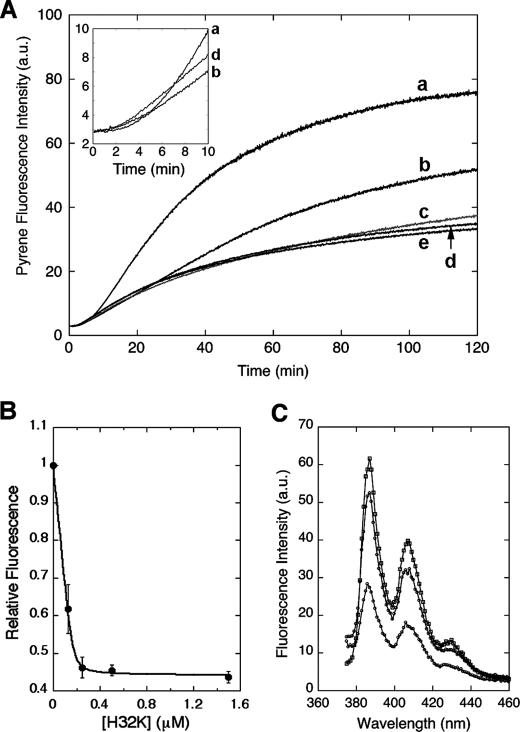
Effect of CaD fragment on the pyrene-actin fluorescence when included at the beginning of the actin polymerization. A, pyrene fluorescence enhancement (in arbitrary units; a.u.) upon actin polymerization was attenuated with increasing amounts of H32K included in the F-buffer (traces labeled a–e from top to bottom represent experiments with 0, 0.125, 0.25, 0.5, and 1.5 μm H32K, respectively; actin concentration, 1.5 μm). Inset, an enlarged rendition of selected traces with 0 μm (trace a), 0.125 μm (trace b), and 0.5 μm (trace d) of H32K showing the pyrene fluorescence increase was accelerated by H32K during the initial 10 min. B, relative intensity of pyrene fluorescence (to that of actin alone, averaged over the period of t = 25 to 120 min) from A is plotted as a function of H32K concentration. The data points are fitted with an equilibrium binding isotherm. The curve represents the best fit with the equation: F = Fo + ΔFν, where Fo is the initial fluorescence, ΔF is the H32K-dependent suppression in the pyrene fluorescence enhancement, and ν is one of the roots of the quadratic equation: nAν2 − (Kd + nA + C)ν + C = 0; n is the stoichiometry defined as the number of H32K molecules bound to one actin subunit, A is the total actin concentration (1.5 μm), Kd is the equilibrium dissociation constant, and C is the total concentration of H32K. The best-fit parameters are: Kd = 3.7 nm and n = 0.114 or ∼1/9. C, emission spectra (excited at 365 nm) of pyrene-actin alone (1.5 μm, top), with H32K (0.5 μm) added at the beginning (bottom) or at 120 min after initiation (middle) of polymerization. All samples were incubated overnight to ensure completion of polymerization.

