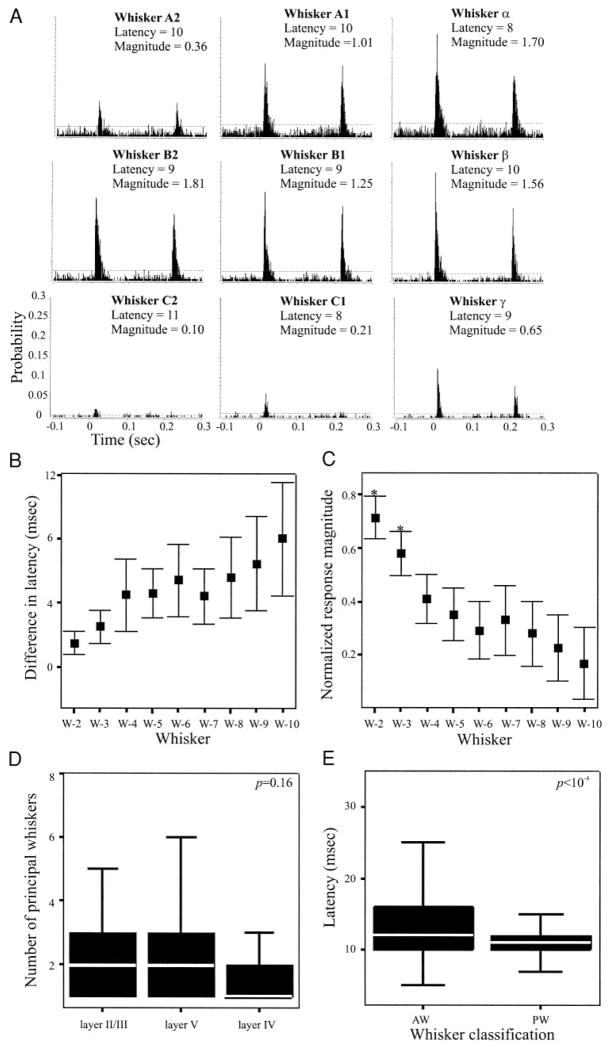
FIG. 3.
Receptive field size of SII neurons, determined from 58 cells for which ≥5 whiskers were stimulated. A: PSTHs depicting responses of a layer V SII neuron to stimulation of different whiskers. Indicated above each PSTH are the whisker stimulated, the response onset latency (ms), and the response magnitude (spikes/stimulus). Stimulation of different whiskers results in responses with similar latencies, but different magnitude. B: relative differences in onset latency to stimulation of different whiskers, computed for all 58 neurons. For each neuron, latencies were normalized to responses to the whisker evoking the shortest latency response (W-1; see text for additional details). Error bars depict ±99% CIs. As a population, SII neurons responded with statistically indistinguishable onset latencies to stimulation of 9 different whiskers. C: similar analysis applied to response magnitudes, normalized to responses of the whisker evoking the largest response (W-1). As a population, SII neurons responded to 3 whiskers with similar response magnitudes [defined as the principal whiskers (PWs)] and with significantly smaller magnitude responses to the adjacent whiskers (AWs). D: neurons in all layers of SII had a similar number of PWs. E: onset latencies of responses to PWs were significantly shorter that those to AWs. All statistical comparisons made with K-S test.

