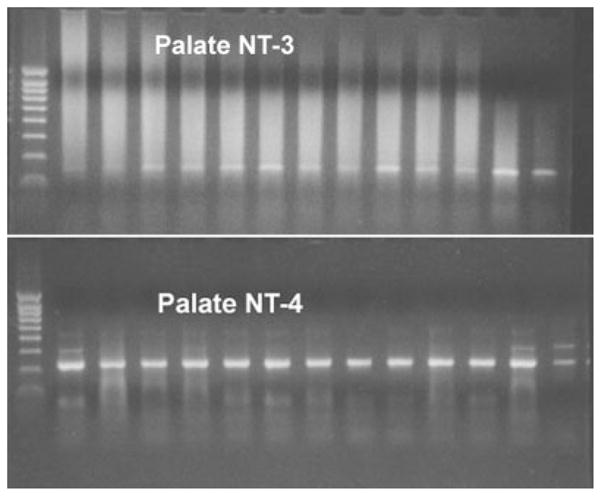
Fig. 2.

Representative PCR gels showing results from 13 ganglion neurons from specimen injected with a tracer into the soft palate. Top: Bands at 150 base pairs (bp) indicate expression of the amplimer for NT-3. Bottom: Bands at 313 bp indicate expression of the amplimer for NT-4. Left lane in both panels is the DNA ladder. Some neurons in the NT-4 panel exhibited a faint band at 400 bp.
