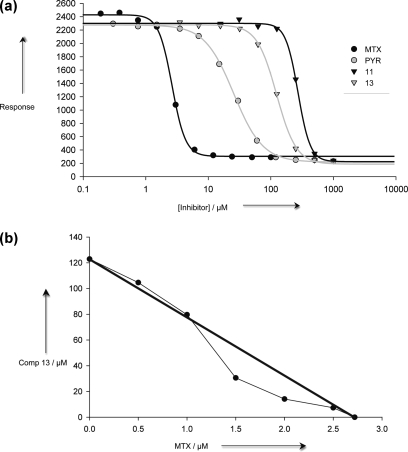
Figure 5.
Trypanocidal activity of PTR1 and DHFR inhibitors. (a) Dose−response plots for cultured T. brucei parasites subjected to increasing concentration of inhibitor. Points are mean values of three separate determinations conducted in quadruplicate (n = 12), std dev ≤ 5%. (b) Changes in 13 ED50 values in combination with varying concentrations (0, 0.5, 1.0, 1.5, 2.0, 2.5 μM) of MTX. Values are the mean ± std dev (n = 4).

