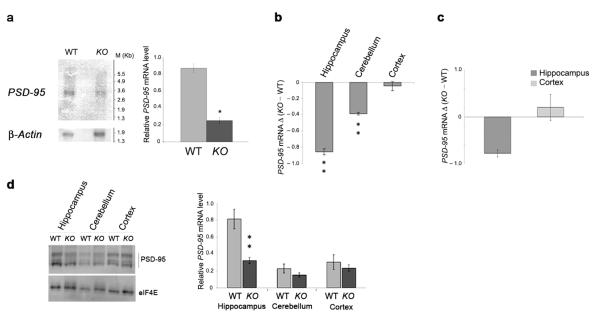
Figure 7. PSD–95 mRNA and protein levels are altered in the FMR1 knockout mice.
(a) PSD–95 and β–Actin mRNA levels from total brain were analyzed by Northern blot in wildtype (WT) or FMR1 knockout (KO) mice. The same membrane was hybridized and normalized for β–Actin mRNA (lower panel). PSD–95 mRNA/β–Actin ratio is reported as a histogram with standard error. (b) PSD–95 mRNA levels in three different brain regions were estimated by quantitative RT–PCR from three wildtype and three FMR1 knockout mice, normalized to those of Histone H3 and reported in a histogram as delta of FMR1 knockout vs wildtype value. Error bars represent standard error. (c) The level of PSD–95 mRNA in hippocampal or cortical neuronal cell culture was estimated by quantitative RT–PCR, normalizing the values to Histone mRNA. The histogram represents the delta of FMR1 knockout vs wildtype value and the bars represent the standard errors of three independent measurements. (d) Protein extracts from cortex, hippocampus or cerebellum of four wildtype and four FMR1 knockout mice were analyzed for PSD–95 and eIF4E proteins and reported in a histogram with standard error (right panel). Western blot from one of the four independent mice analyzed for PSD–95 and eIF4E is shown. *, p<0.05 and **, p<0.01 for knockout versus wildtype by Student’s t test in all panels.

