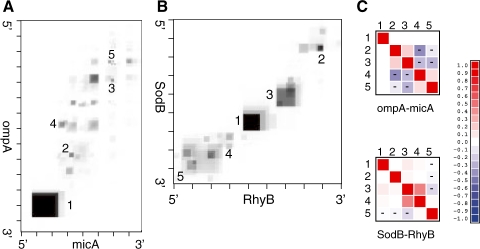
Fig. 10.
Interaction maps. The ompA–MicA interaction (A) has a dominating interaction region that brings together the 3′ end of ompA and the 5′ terminus of MicA. The sodB–RhyB interactions (B) has two clear hybridization regions in the middle of the molecules and a diffuse contact area at the 3′ end of sodB. The grayscale show the probabilities πik. Tick marks indicate every 10th nucleotide. The correlations between the major binding regions can be computed easily from Boltzmann samples. The heatmaps show the correlation coefficients for the most probable interaction regions (indicated by numbers in the interaction maps). (C) For sodB–RhyB, we observe fairly weak correlations, except for the cooperative interaction between contacts 3 and 4. In case of ompA–MicA, we observe strong negative correlations between conflicting hybridization regions.

