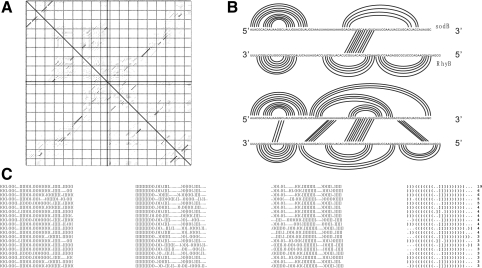
Fig. 9.
Interaction of sodB–RhyB. (A) Base-pairing probability matrix. The upper right triangle shows the probabilities obtained from the exact backwards recursion, the lower left triangle is the estimate from a sample of 10 000 structures obtained by stochastic backtracing, showing that the estimates converge quickly. (B) Comparison of the structure proposed in Geissmann and Touati (2004) and the rip2 prediction. While the major stable hairpins agree and rip2 correctly predicts the primary interaction region, rip2 also identifies additional interaction regions that may stabilize the interaction. (C) Sampled joint structures (here the 20 most frequent ones) are represented as dot-bracket strings: () and [] represent pairs of interior and exterior arc, respectively, while dots indicate unpaired bases. | separates the two RNA sequences which are both written in 5′ → 3′ direction.

