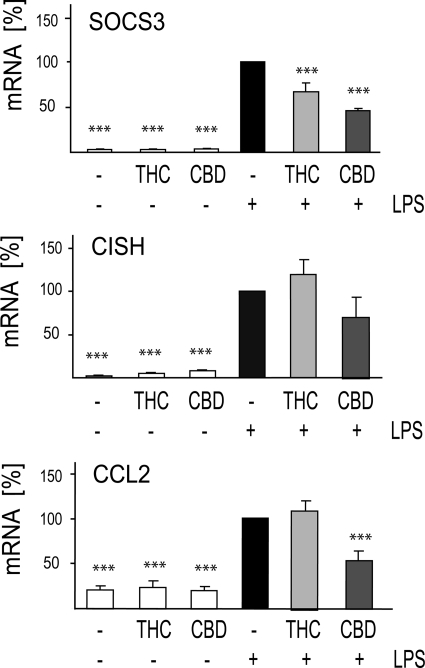
FIGURE 9.
LPS up-regulated SOCS3, CISH, and CCL2 mRNAs are differently modulated by CBD and THC. Cells were treated for 2 h with 10 μm THC or CBD. LPS (100 ng/ml) was then added, and 4 h later the cells were harvested, and RNA was extracted for qPCR analysis. The bar graphs present the percent of mRNA expression (average ± S.E. from three to four independent experiments) versus LPS-only treated samples (taken as 100%). One-way ANOVA was used as follows: for SOCS3 F(5,12) = 100.5, p < 0.001; for CISH F(5,12) = 20.7, p < 0.001; for CCL2 F(5,12) = 32.81, p < 0.0001. Dunnett's post hoc test: ***, p < 0.001 versus LPS.

