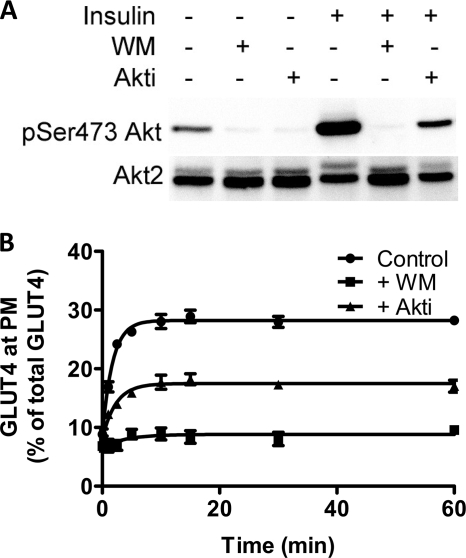
FIGURE 2.
Akt control of the transition from basal to insulin-stimulated state. A, Akt activation was determined by blotting for phosphoserine 473 in basal cells and cells treated with insulin (upper panels). Both basal and insulin-treated cells were also treated with wortmannin (WM) and Akti as indicated. Akt2 levels were determined from the same solubilized cell lysates (bottom panels). B, rate of transition from the basal to the insulin-stimulated state in the absence (●) and presence of wortmannin (■), and Akti (▴) was determined in fixed cells using HA primary antibody and an Alexa 488 secondary antibody. Each point represents the mean ± S.E. from three experiments. In some cases error bars are smaller than the symbol.

