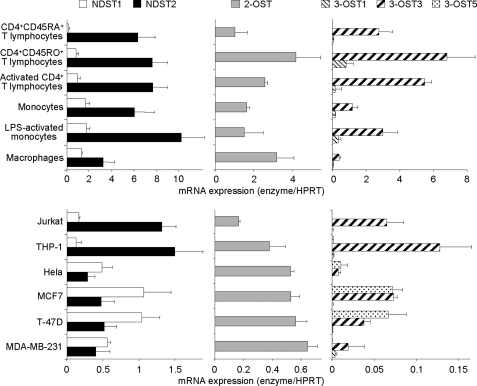
FIGURE 5.
Expression of mRNAs encoding HS sulfotransferases. Total RNA was extracted from primary CD4+ T lymphocyte subsets, monocytes/macrophages, and various cell lines (Jurkat, THP-1, HeLa, MCF7, T-47D, and MDA-MB-231). Following reverse transcription, variations in the levels of expression of NDST1, NDST2, 2-OST, 3-OST1, 3-OST3, and 3-OST5 transcripts were quantified by real time PCR, as described under “Experimental Procedures.” Relative transcript abundance was normalized to endogenous control hypoxanthine-guanine phosphoribosyltransferase (HPRT) mRNA. Data are means ± S.D. from triplicates and are representative of at least three experiments performed independently.

