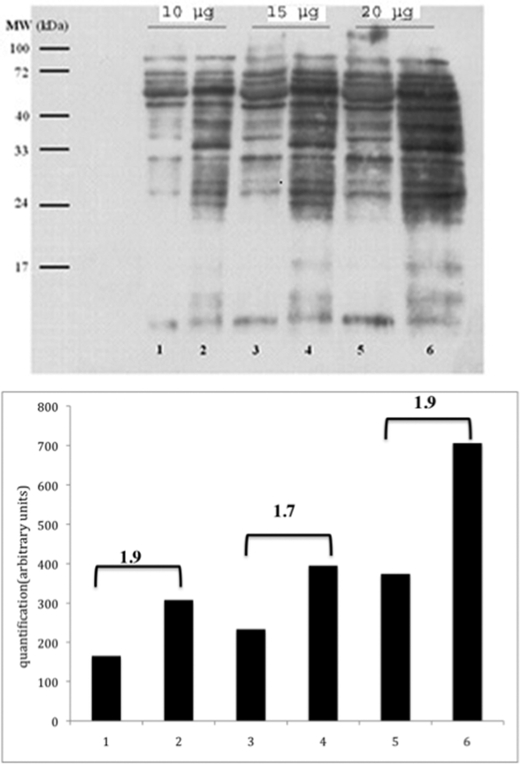
FIGURE 4.
Protein carbonylation of mitochondria isolated from wild type and Δtpk3 cells. Detection of carbonylated proteins was performed using the Chemicon OxyBlot detection kit as described under “Experimental Procedures.” Lanes 1, 3, and 5, wild type isolated mitochondrial extracts; lanes 2, 4, and 6, Δtpk3 extracts. The three sets correspond to increasing amounts of mitochondrial proteins. The numbers on the quantification graph correspond to the ratio between carbonylation levels in the mutant versus the wild type. Quantification was assessed using the ImageJ software.

