FIGURE 1.
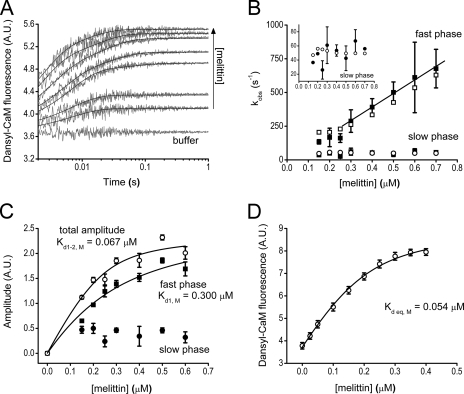
Binding of Ca2+-saturated dansyl-CaM to the model peptide melittin. A, fluorescence time courses on the reaction of 0.1 μm (final concentration) dansyl-CaM with buffer or with 0.15–0.6 μm melittin. Stopped-flow traces are shown in gray, black lines through the data represent the best double exponential fits to the curves. The x axis is shown from t = 0.002 s (the dead time of the stopped-flow apparatus), exponential fits converge to the fluorescence intensity level of the “buffer” curve. B, melittin concentration dependence of the observed binding rate constants from exponential fits to the stopped-flow traces (fast phase, ■; and slow phase, ●) or from kinetic simulation of the same time courses (fast phase, □; slow phase, ○). A linear fit to the pseudo-first order part of the curve yielded k+1,M = 1004 ± 366 μm−1 s−1. The rate constants of the slow phase (inset, ●) did not exhibit concentration dependence and had a first-order k2,obs,M = 49 ± 13 s−1. C, amplitude titration extracted from the exponential fits to the stopped-flow traces. The quadratic fit (smooth line through the data) to the concentration-dependent fast phase (■) comprising 88% of the total amplitude at the highest measured concentration yielded an apparent Kd of 0.3 ± 0.15 μm. The amplitude of the slow phase (●) exhibited a tendency to decrease with concentration. Fitting the total amplitude data (○) yielded a Kd of 0.067 ± 0.044 μm. D, equilibrium fluorescence titration of 0.2 μm dansyl-CaM with melittin. The Kd from the quadratic fit is 0.054 ± 0.016 μm. Error bars represent the sample standard deviation of the average of data points obtained from different experiments.

