FIGURE 2.
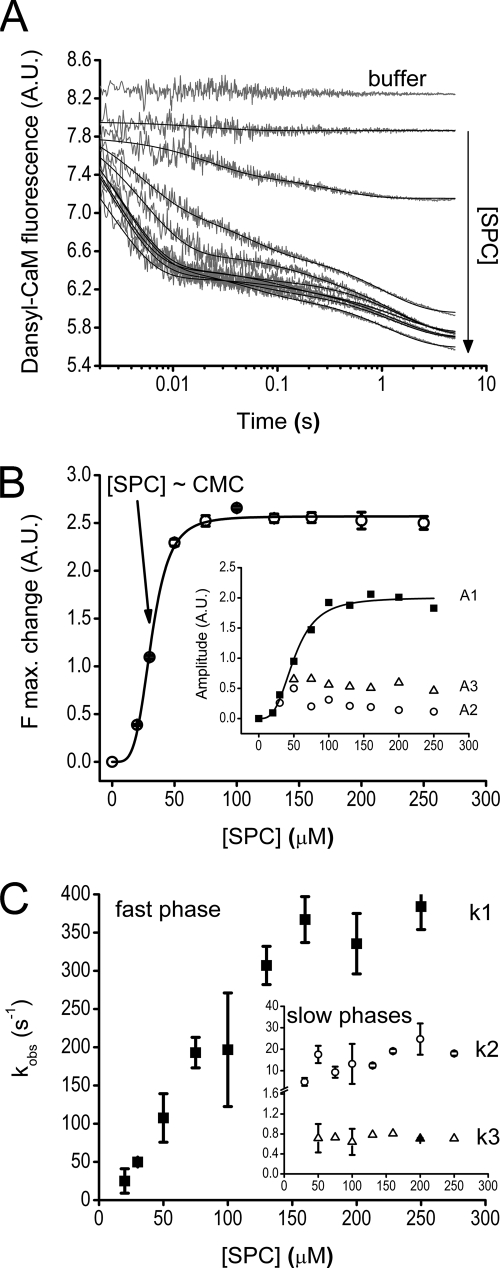
Kinetics of the interaction of SPC with the Ca2+-saturated dansyl-CaM-melittin complex. A, time courses of melittin dissociation from dansyl-CaM after mixing an equilibrated sample of 0.4 μm dansyl-CaM and 0.8 μm melittin with 0–500 μm SPC (pre-mix concentrations). The first trace was best fitted with single, the second with double, and further curves with triple exponentials represented by the smooth lines through the data. B, concentration dependence of the amplitudes (inset, A1 (■), A2 (○), and A3 (△)) and maximal fluorescence changes derived from the exponential fits to the stopped-flow traces shown in panel A. Maximal fluorescence change was calculated from the ymax value of the exponential fits. A Hill equation having n = 4 ± 0.4 and a half-maximal signal change at [SPC] = 32 ± 0.7 μm, close to the previously determined CMC for SPC, provided the best fit to the curve. Similar fit to the amplitude of the fast phase yielded n = 3 ± 0.5 and A1,max/2 = 51 ± 3 μm. At saturation, the three observed kinetic phases A1, A2, and A3 take 78, 4, and 18% shares of the total amplitude, respectively. C, SPC concentration dependence of the observed rate constants of the fast (main panel, ■) and slow (inset, k2, ○; k3, △) phases. The fast phase data showed linear concentration dependence and reached saturation at about 150 μm SPC with k1,sat,SC = 348 ± 30 s−1. The two slower phases did not depend on SPC concentration in the measured range and varied in the range of k2,obs,SC = 14 ± 6 s−1 and k3,obs,SC = 0.9 ± 0.3 s−1. Error bars represent the sample standard deviation of the average of data points obtained from different experiments.

