FIGURE 3.
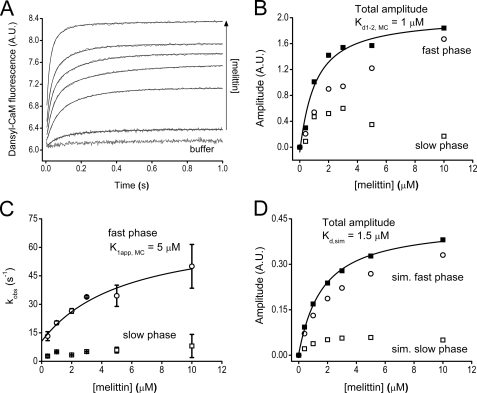
Dissociation of the Ca2+-saturated dansyl-CaM-SPC complex by melittin. A, time courses of the chasing experiment. Equilibrated 0.4 μm dansyl-CaM and 100 μm SPC were mixed with 0–20 μm melittin (pre-mix concentrations). Smooth lines represent double exponential fits to the data. B, concentration dependence of the amplitudes (fast phase, circo; slow phase, □; and total amplitude, ■) derived from exponential fits to the stopped-flow traces. The best quadratic fit to the total amplitude curve yielded an apparent Kd1–2,MC of 1 ± 0.3 μm. C, concentration dependence of the observed rate constants of the fast (○) and slow (□) phases. The fast phase was best fitted with a quadratic equation having an y intercept at 10 ± 4 s−1, a rate constant of 59 ± 13 s−1 at saturation, and an apparent Kd = 5.4 ± 3.4 μm. The slow phase exhibited a weak dependence on melittin concentration and the kobs varied between 4 and 8 s−1. D, analysis of simulated time courses. Kinetic parameters used for the simulation are shown in Fig. 8. Concentration dependence of the amplitudes of exponential fits to the simulated curves (fast phase, ○; slow phase, □, and total amplitude, ■). The best quadratic fit to the total amplitude curve yielded an apparent Kd of 1.5 ± 0.12 μm. Error bars represent the sample standard deviation of the average of data points obtained from different experiments.

