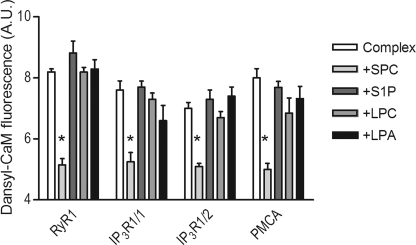
FIGURE 6.
SPC-induced dissociation of complexes between Ca2+-saturated CaM and peptides derived from proteins involved in Ca2+ homeostasis. Bars depict the fluorescence intensity of 0.2 μm Ca2+-saturated dansyl-CaM with peptides from RyR1, IP3R1, and PMCA (see Table 1 for details) at a concentration of 0.5 μm, in the absence (white bars) and presence (gray bars) of 100 μm SPC, S1P, LPC, and LPA, respectively. Mean ± S.E. values were calculated from three independent experiments, and the asterisks represent a significant decrease (p < 0.05), based on Student's t test.

