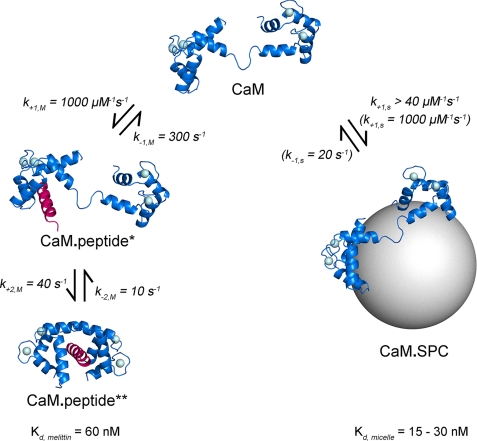
FIGURE 8.
Schematic representation of the model by which SPC competes for CaM with target peptides. Protein Data Bank codes 1CLL and 1CDM were used to prepare the structures representing CaM and the CaM·peptide** complex, respectively. The CaM (blue) and peptide (magenta) molecules are shown as schematics. Bound Ca2+ ions are shown as light blue spheres. The CaM·peptide* and the CaM·SPC species are purely hypothetical, and are depicted by the Ca2+-saturated CaM structure PDB 1CLL bound to the peptide or the micelle. The SPC micelle is depicted as a gray sphere with a diameter comparable with the width of a lipid bilayer. The figure was prepared using PyMOL (DeLano Scientific). Rate constants shown in brackets are estimated values and were used for global simulations.

