FIGURE 1.
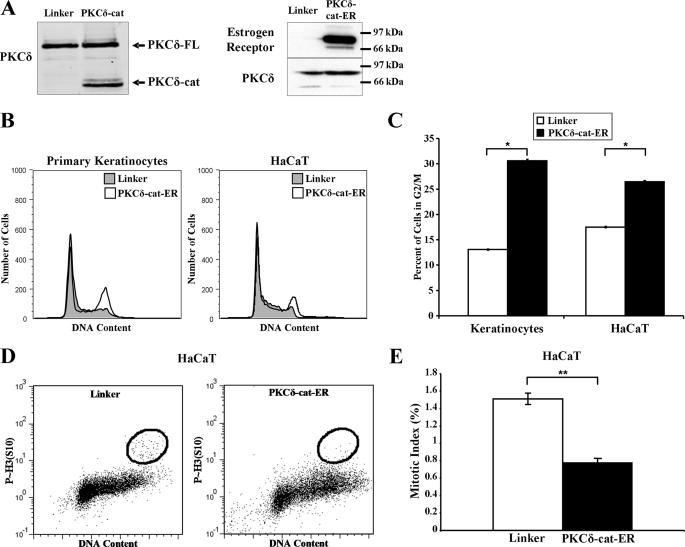
PKCδ-cat expression induces G2/M cell cycle arrest. A, Western blots displaying relative levels of full-length PKCδ protein (PKCδ-FL) and PKCδ-cat are shown in control Linker-, PKCδ-cat-FLAG-, and PKCδ-cat-ER-transduced KCs. PKCδ-cat-ER-transduced cells display a strong ER-positive band at the same position as the PKCδ protein, indicating successful expression of the ER fusion protein. B, representative DNA content histograms of primary KCs and HaCaT cells transduced with either Linker or PKCδ-cat-ER retrovirus are shown. Propidium iodide staining was performed 2–3 days after infection. Similar results were obtained in at least three independent experiments. C, quantitation of the percentage of cells containing G2/M DNA content in KCs and HaCaT cells 2–3 days following infection with either Linker control or PKCδ-cat-ER retrovirus. Graphs represent experiments done in triplicate. *, Student's t test value of p < 0.005. D, HaCaT cells transduced with either Linker or PKCδ-cat-ER retrovirus were harvested and stained for phosphorylated histone H3 (Ser10) and propidium iodide after 3 days and analyzed by flow cytometry. E, quantitation of mitotic indices from HaCaT cells treated as described for D. **, Student's t test value of p < 0.001. Error bars denote the S.D.

