FIGURE 3.
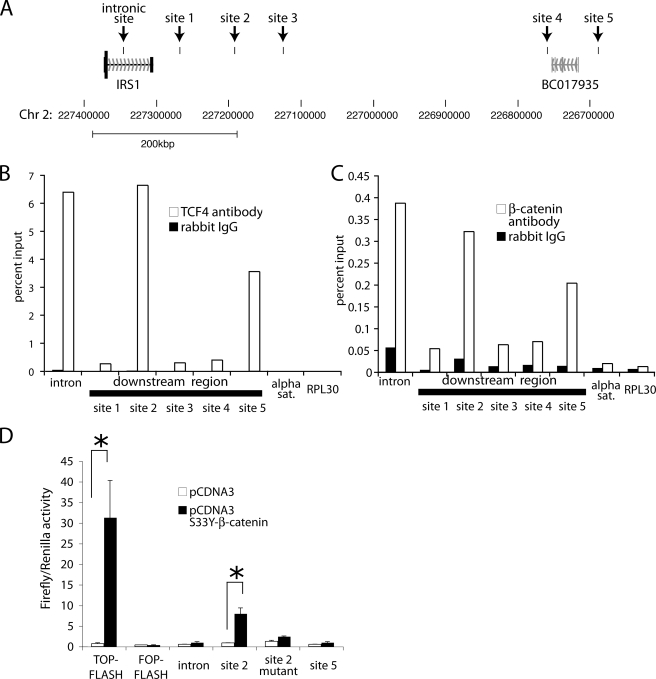
IRS1 directly binds to downstream enhancers of IRS1. A, schematic representation of the IRS1 locus. Black boxes mark the tested IRS1 binding sites in the intron and downstream of the IRS1 transcript. B, chromatin immunoprecipitation of DLD1 cells using an antibody against TCF4 shows binding to intronic and regions downstream of the IRS1 gene. Relative recovery of the immunoprecipitation was measured by quantitative PCR and is normalized to the amount in the chromatin immunoprecipitation input. Chromatin immunoprecipitation using IgG and amplification of irrelevant multicopy (α-sat) or single copy (RPL30) locus were used demonstrate specificity. Recovery of RPL30 and α-satellite with TCF4 antibody was 0.048 and 0.040%, respectively, which is not visible in this scale. C, chromatin immunoprecipitation using an antibody against β-catenin was performed as described in B. D, 293T cells were transfected with the indicated reporter plasmids containing a minimal promoter and the genomic region encompassing the intronic as well as the strongest binding sites of β-catenin downstream of the IRS1 gene. Firefly luciferase activity in the absence or presence of S33Y β-catenin plasmid were normalized to the activity of a cotransfected constitutively active Renilla luciferase construct. Asterisks denote significance with p < 0.05 in Student's t test, and error bars denote S.D.

