FIGURE 5.
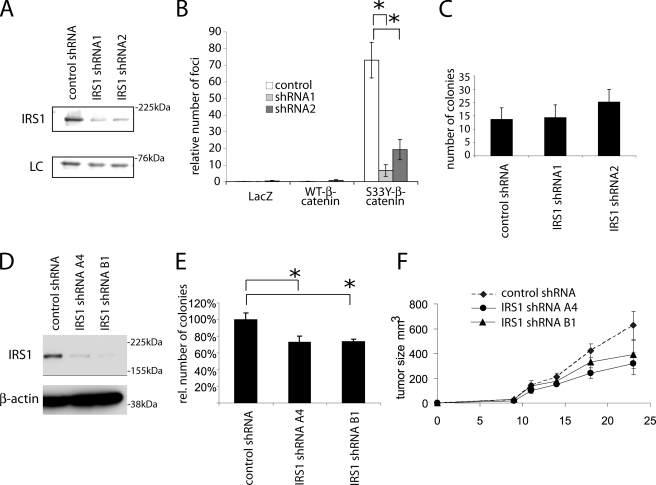
Down-regulation of IRS1 expression by RNA interference reduces β-catenin-dependent neoplastic transformation. A, Western blot analysis of IRS1 protein levels in the S33Y-β-catenin-transformed RK3E cell lines, upon retroviral transduction with constructs driving expression of two different shRNAs targeting Irs1 (shRNA1 and shRNA2) and a nonsilencing control shRNA. To demonstrate equal loading a nonspecific band at 66 kDa is shown. B, transformation of RK3E cells expressing different Irs1 shRNAs after transduction with retroviruses driving expression of a stabilized mutant of β-catenin (S33Y), wild-type β-catenin (WT-β), or β-galactosidase (LacZ). Cells were transduced with the corresponding retroviruses and focus formation was observed for 3 weeks. Bars denote the number of foci and standard deviation from three independent experiments. Representative methylene blue-stained plates are shown in supplemental Fig. S2. C, soft agar colony formation of RK3E cells expressing two different IRS1 shRNAs or a negative control shRNA after transduction with G12V mutant K-Ras. Cells were plated in 0.3% soft agar 2 days after transduction (without selection) and cultured for 2 weeks. Values represent the colony numbers of triplicates, mean ± S.D. Asterisks denote p < 0.05 in Student's t test. D, Western blot analysis of IRS1 protein levels in HT29 colorectal cancer cells upon transduction with retroviruses driving expression of two different shRNAs targeting IRS1 (shRNA-A4 and shRNA-B1) or a nonsilencing control shRNA. To demonstrate equal loading β-actin levels are shown. E, soft agar colony formation of the cells from D. Colony numbers are represented relative to the number of colonies in the cell line expressing a nonsilencing shRNA. Values are mean and S.D. of three experiments performed in triplicates. F, xenograft tumor growth after subcutaneous injection of the cells from C in immunocompromised nude mice. Five mice for each group were injected on both flanks (i.e. 10 tumors per group). Asterisks denote significance with p < 0.05 in Student's t test, and error bars represent mean ± S.E.

