FIGURE 2.
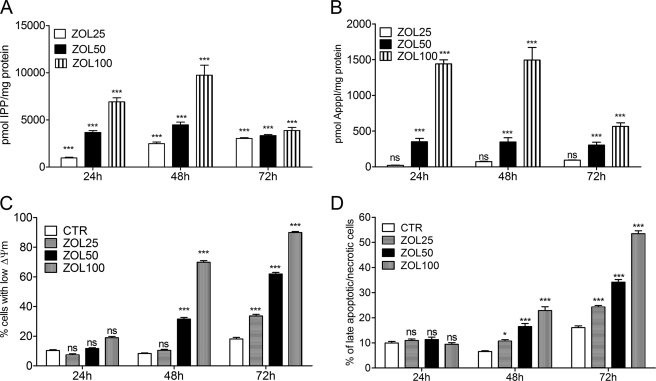
Kinetics of ZOL-induced IPP/ApppI formation and apoptosis. HF28RA cells were treated with 25–100 μm ZOL for different time intervals up to 3 days. The molar amount of IPP and ApppI was determined in cell extracts by HPLC-ESI-MS using 1 μm AppCp as the internal standard. A, shown is IPP accumulation. B, shown is ApppI production in the HF28RA cell line. C, shown are the effects on the mitochondrial transmembrane potential, ΔΨm, evoked by the indicated concentrations of ZOL determined by cytofluorimetry using TMRM staining. CTR, control. D, cell membrane integrity (late apoptosis/necrosis) assessed by flow cytometry using propidium iodide is shown. 5000 events per condition were collected for each histogram. The data are presented as the mean ± S.E. from 3–5 independent experiments. The statistical significance of the differences was determined using the ANOVA test with the Bonferroni post-test; ns, not significant (p > 0.05); p < 0.05 (*) and p < 0.001 (***) versus control.

