FIGURE 3.
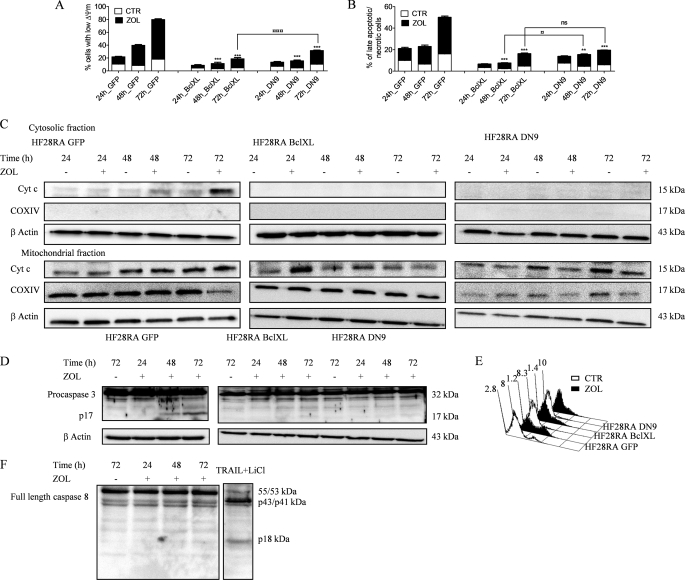
ZOL-induced death signaling is mediated through the mitochondrial pathway. HF28RA control (GFP, CTR), BclXL, and DN caspase-9-overexpressing cells were treated with 50 μm ZOL for various times (0–72 h). Mitochondrial membrane potential (A) and cell membrane integrity (B) were measured by flow cytometry; 5000 events per condition were collected for each histogram. The data are presented as the mean ± S.E. from 3–8 independent experiments. ns, not significant (p > 0.05); p < 0.01 (**) and p < 0.001 (***) versus corresponding ZOL treatment effects on HF28RA GFP cells; p < 0.05 (□) and p < 0.001 (□□□) when compared ZOL exposure effects on MMP or membrane integrity of HF28RA BclXL versus ZOL exposure effects on HF28RA DN9 cells. C, time course of cytochrome c (Cyt c) expression in HF28RA cells by Western blot in control (HF28RA GFP)-, BclXL-, and DN caspase-9-modified constructs. Cytochrome oxidase subunit IV (COXIV) was used as a control for enrichment quality, and β-actin was used as a control for equal protein loading. One representative experiment from three is depicted. D, shown is caspase-3 status in apoptotic and non-apoptotic cell lysates. HF28RA cells were left untreated (lane 1) or were treated with ZOL 50 μm for the indicated times (lanes 2–4) to induce apoptosis. Western blot analysis using polyclonal caspase-3 antibodies (recognizing both pro- and active caspase-3) shows that procaspase-3 (32 kDa) is present in both untreated and apoptotic lysates, but active caspase-3 (17 kDa) is present only in apoptotic lysates of control vector/GFP cells, whereas no active fragment could be seen at any exposure time point in BclXL- and DN9-overexpressing cell lines. Three independent experiments yielded similar results. E, shown is PhiPhiLux flow cytometric analysis of caspase-3-like activity in intact cells undergoing apoptosis. GFP, BclXL, and DN caspase-9 HF28RA cells were left untreated (CTR) or treated for 72 h with ZOL to induce apoptosis. Cells were stained with G2D2-conjugated PhiPhiLux. Numbers indicate the percentage of cells with activated caspase-3. Histograms were assembled into three-dimensional plots using WinMDI 2.8 software. A study representative of two is shown. F, shown is caspase-8 expression after 50 μm ZOL exposure for different time intervals. Procaspase-8 was identified as a band of 55/53 kDa, and the cleaved caspase-8 was identified at 43/41 and 18 kDa. As positive control we used an extract from TRAIL + LiCl-treated HF28RA wild type cells. Similar data were obtained in another independent study.

