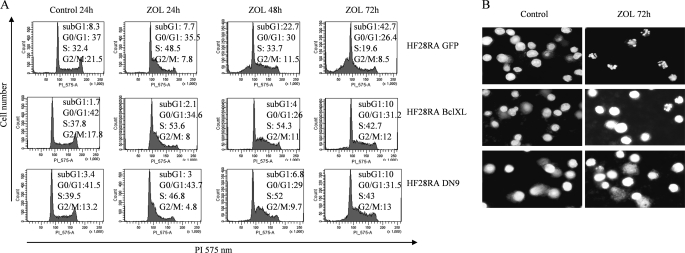
FIGURE 4.
BclXL and DN caspase-9 block cell cycle-progression in S phase and subsequent chromatin condensation in HF28RA cells. A, analysis of the nuclear DNA content upon treatment with ZOL is shown. Cell cycle distributions of HF28RA control GFP-, BclXL-, and DN caspase-9-modified cell lines treated or not with 50 μm ZOL for up to 72 h were analyzed by propidium iodide staining and fluorescence-activated cell sorter analysis. G0-G1, G2-M, and S indicate the cell phase, and sub-G1 DNA content refers to the percentage of apoptotic cells. 10,000 events per condition were collected for each histogram. A study representative of three is shown. B, at the end of the experiment cells were stained with Hoechst 33342 and photographed under UV illumination.

